How to overcome your biases and get better results from data exploration: A conversation with author Tobias Zwingmann
.png)
Written by Virtualitics
Sep 22, 2022 2:14:10 PM
Below is the transcript and accompanying images from a webinar we held with data scientist and author, Tobias Zwingmann, and Virtualitics Co-Head of AI, Aakash Indurkhya. You can listen to the podcast here or on major podcasting apps, such as Apple Podcasts, Spotify, or iHeartRadio.
Caitlin - So as mentioned in the title, we're talking about bias today. Bias gets introduced into data and analytics and AI projects really quite early, because projects start when someone in the business observes an issue. They would suspect a problem, or maybe they think there's an opportunity to do something better.
And usually with that observation comes a hypothesis. For example, maybe it's been observed that supplies are arriving a little later than is needed. And so, you know, the natural suspect is a supply chain problem. The problem is then brought to the data team to investigate further.
So it's the problem, and again, the hypothesis–the suspicion of what perhaps is behind it–is brought to this team and it's investigated. And the data science team starts to gather all the data that they need to investigate and really try to see what is going on. But the data that is brought together is narrowed and windowed down…
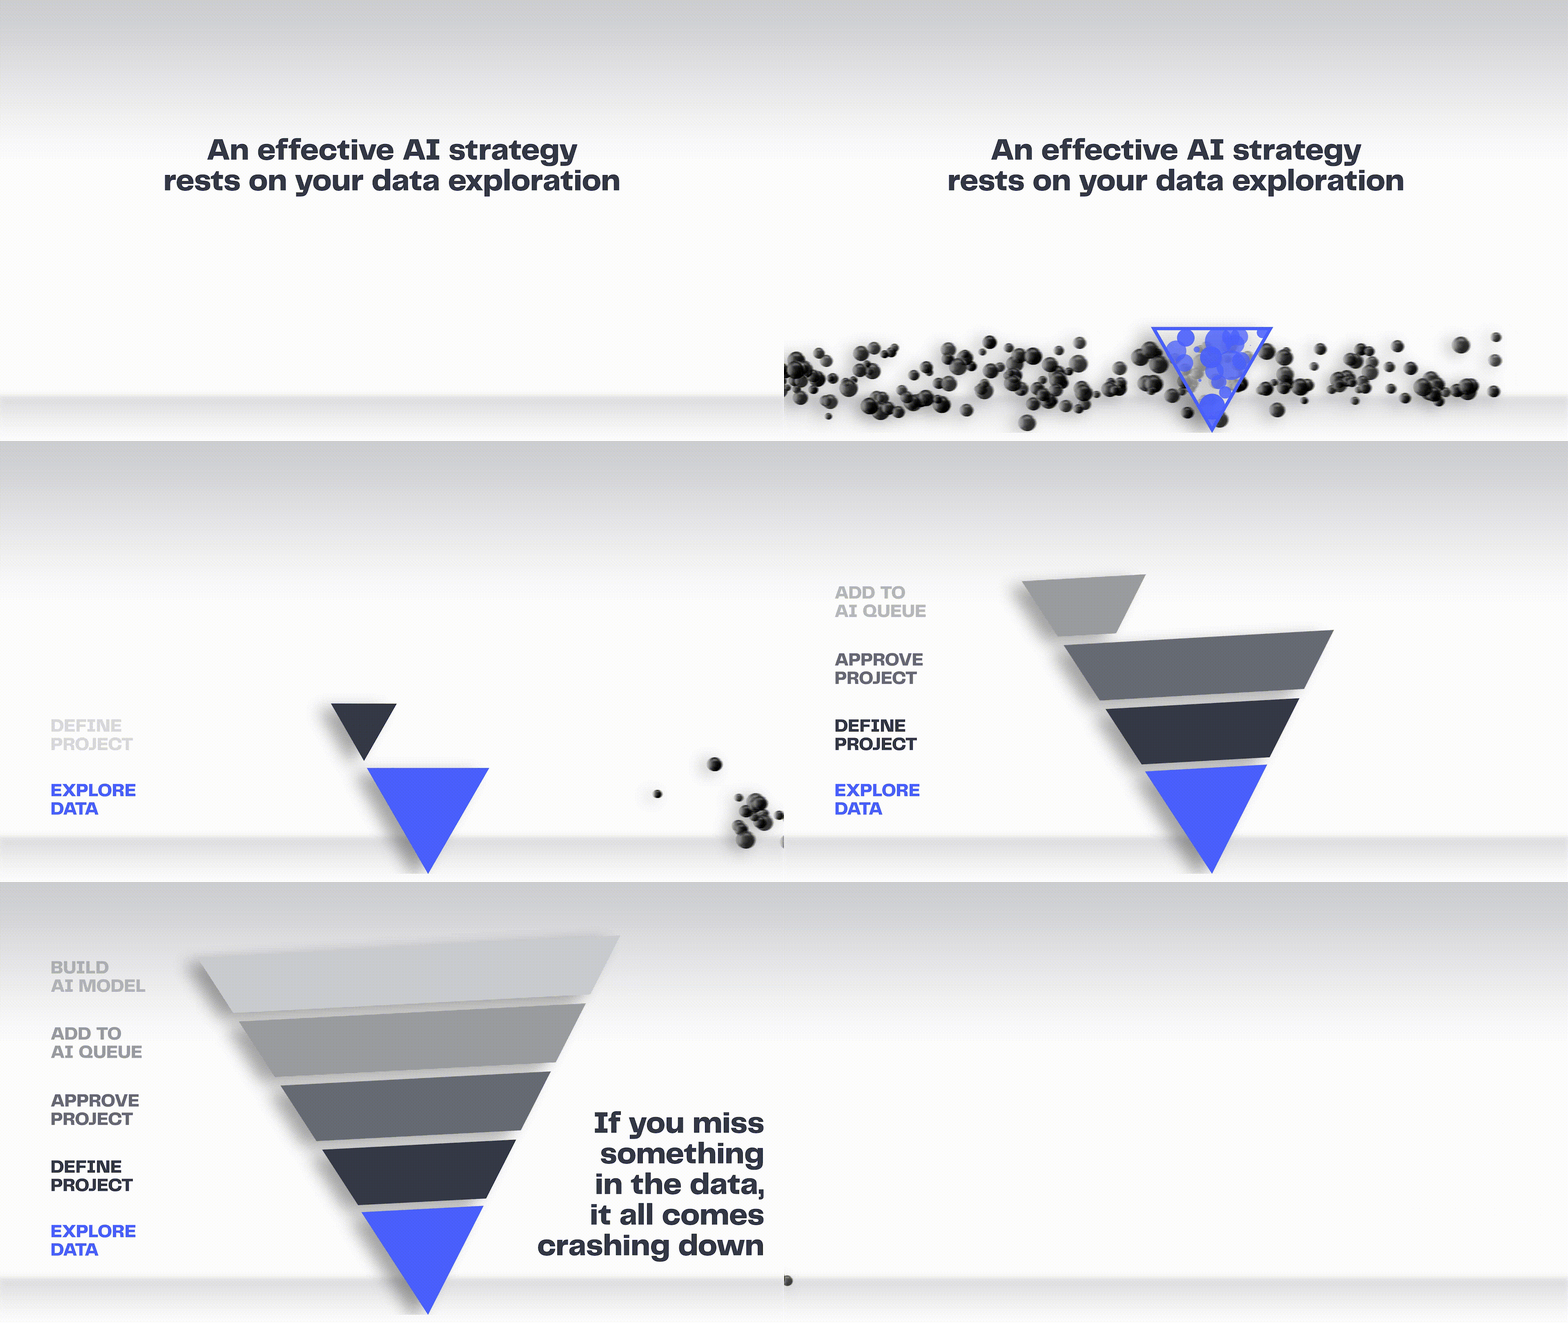
…based on the hypothesis. Because it's next to impossible to explore all of the possible data that you have. So instead we capture some of it and explore what we have there. And then we build everything out from that point. But it's not always building on a solid foundation because we're leaving stuff out. We're leaving out critical pieces, but we're still making some discoveries to move forward.
 But what if what we left out has impacted what we built? What if the AI model we ended up building wasn't robust enough? What if it wasn't targeting the right problem? We found a problem, but not the problem. Whether that data we left out could have just fine-tuned what we did to make it a bit more impactful, or whether the data we left out could have actually fundamentally changed how we understood the problem, we're really putting everything at risk by not looking at the problems more holistically from the start. And that's really a big risk to the business. There's a lot of risk in leaving insight on the table.
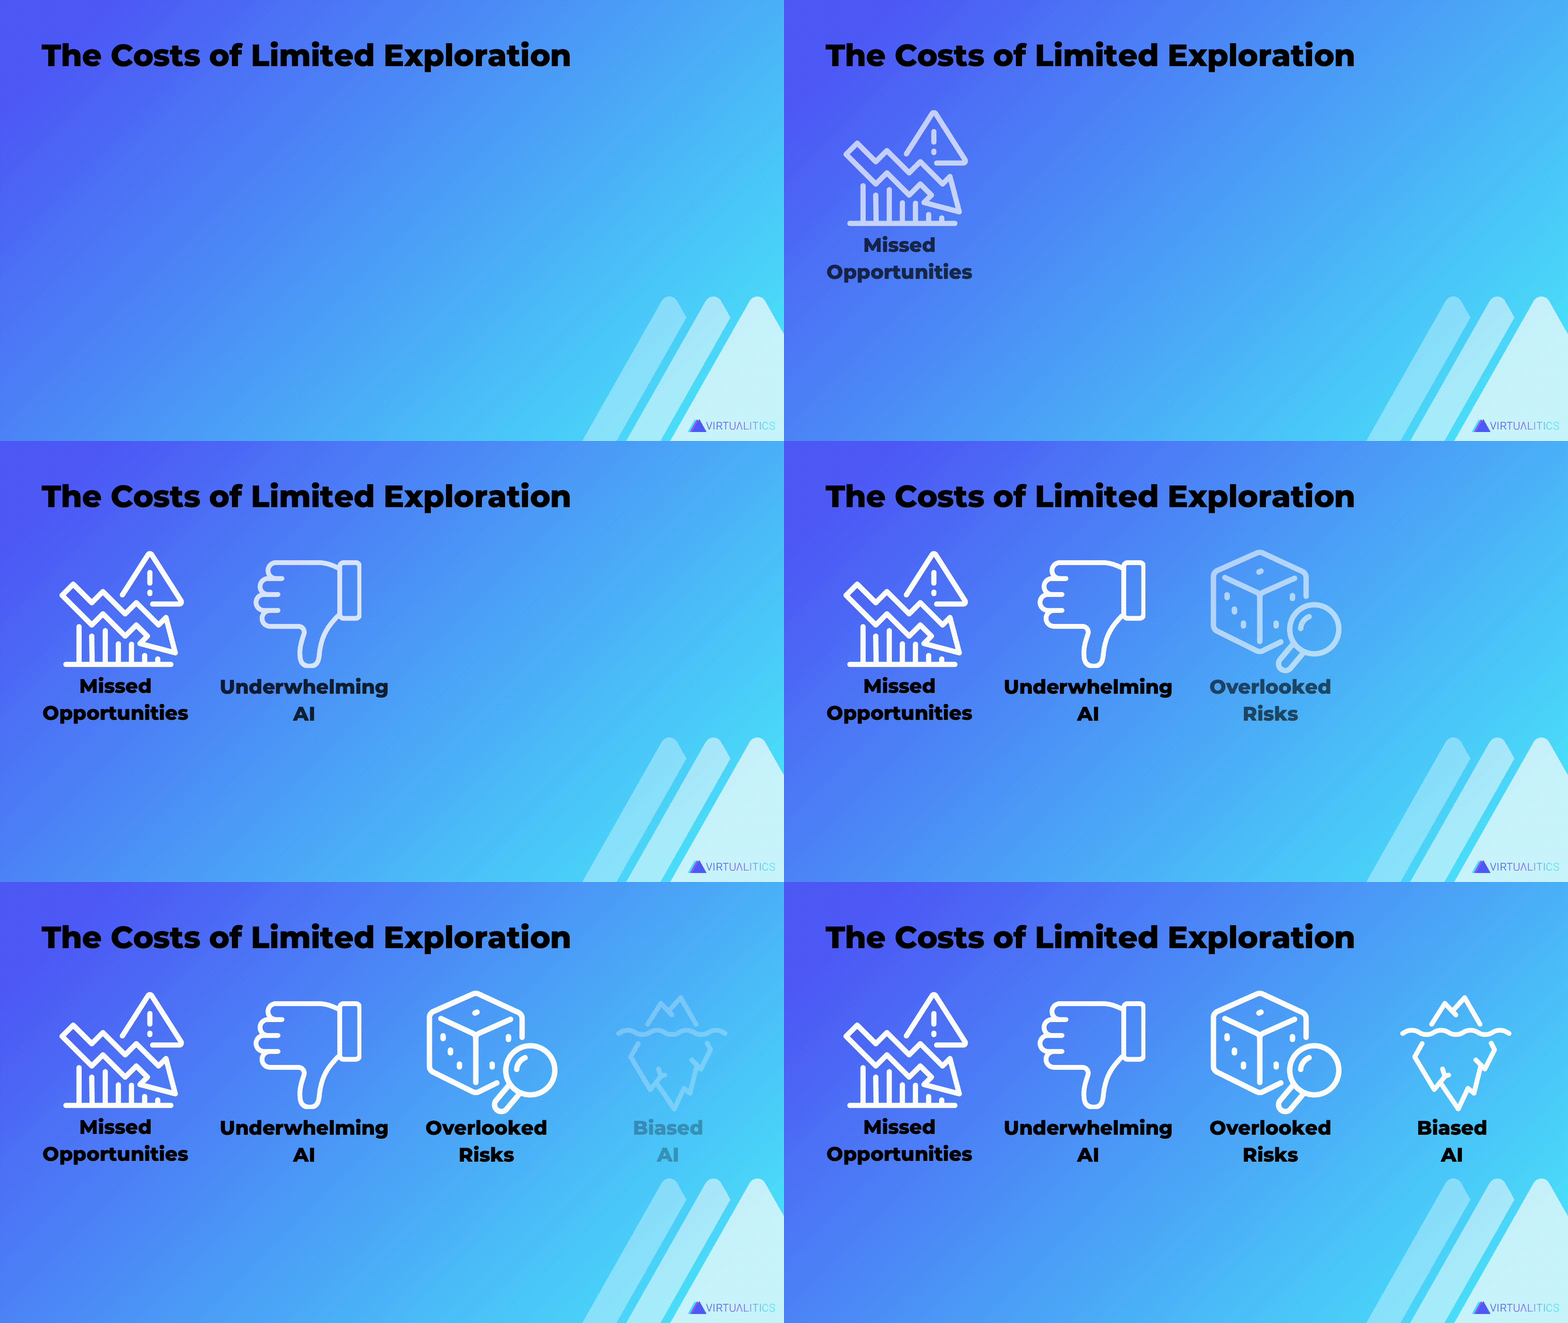 So we're calling this limited exploration hypothesis-led in exploration. And there are costs to it. There are those missed opportunities–targeting a problem, but not the problem. So allowing something else to continue, to operate unchecked, because it's just kind of been overlooked or maybe not fully appreciated for the impact that it's having.
There's the underwhelming AI, because when you fix something that's not the biggest problem, you're not really having the biggest impact. Or perhaps it's not as impactful because it doesn't include as much information as it could to be more really finely targeted.
You could be leaving out information about risks because you're leaving out information that could create a fuller picture, therefore you're taking action in the wrong direction or maybe not quite the way you should.
Or you're allowing some of the data to kind of unduly influence the result. The impact of some data appears outsized because you've left out other information that could provide context, or sort of strengthen, or move things in other directions.

But when you actually start to do your investigation with AI, you can really rethink all of that and look at everything quite differently.
When we think of AI models, we tend to think of them being the outcome of a bunch of work rather than a tool that we can use up-front. And when we say Intelligent Exploration, we're talking about AI-led, AI-guided exploration. And there's a huge number of advantages to doing your exploration using AI upfront.
You're able to explore far more dimensions–where some of those traditional BI tools are really meant for exploring smaller groups of data. And therefore you have to winnow what you look at in order to actually manage it–when you start using AI, AI is perfectly suited to exploring tons of data. And this means you can include way more factors in your exploration.
And therefore you also start to see more relationships in the data. I think if COVID-19 taught us nothing, it taught us just how incredibly interconnected everything is. I mean, who would've thought that a year and a half into COVID I'd have trouble finding a fridge because of supply chain issues? That kind of interconnectedness isn't always obvious to the naked eye but AI is able to pull that out and uncover that. And that's the kind of stuff we need to understand if we're going to build any kind of data-driven projects.
It can start to give you clarity and direction. Again, if you're looking at a sea of data, you also need something to help point the way so that we're not doing that guess and check approach, that hypothesis approach. It can cut through the noise and give us some direction.
And finally, it's open-minded. It’s looking at the data as it is, not as we expect it to be. It's not being driven by our own assumptions about it.
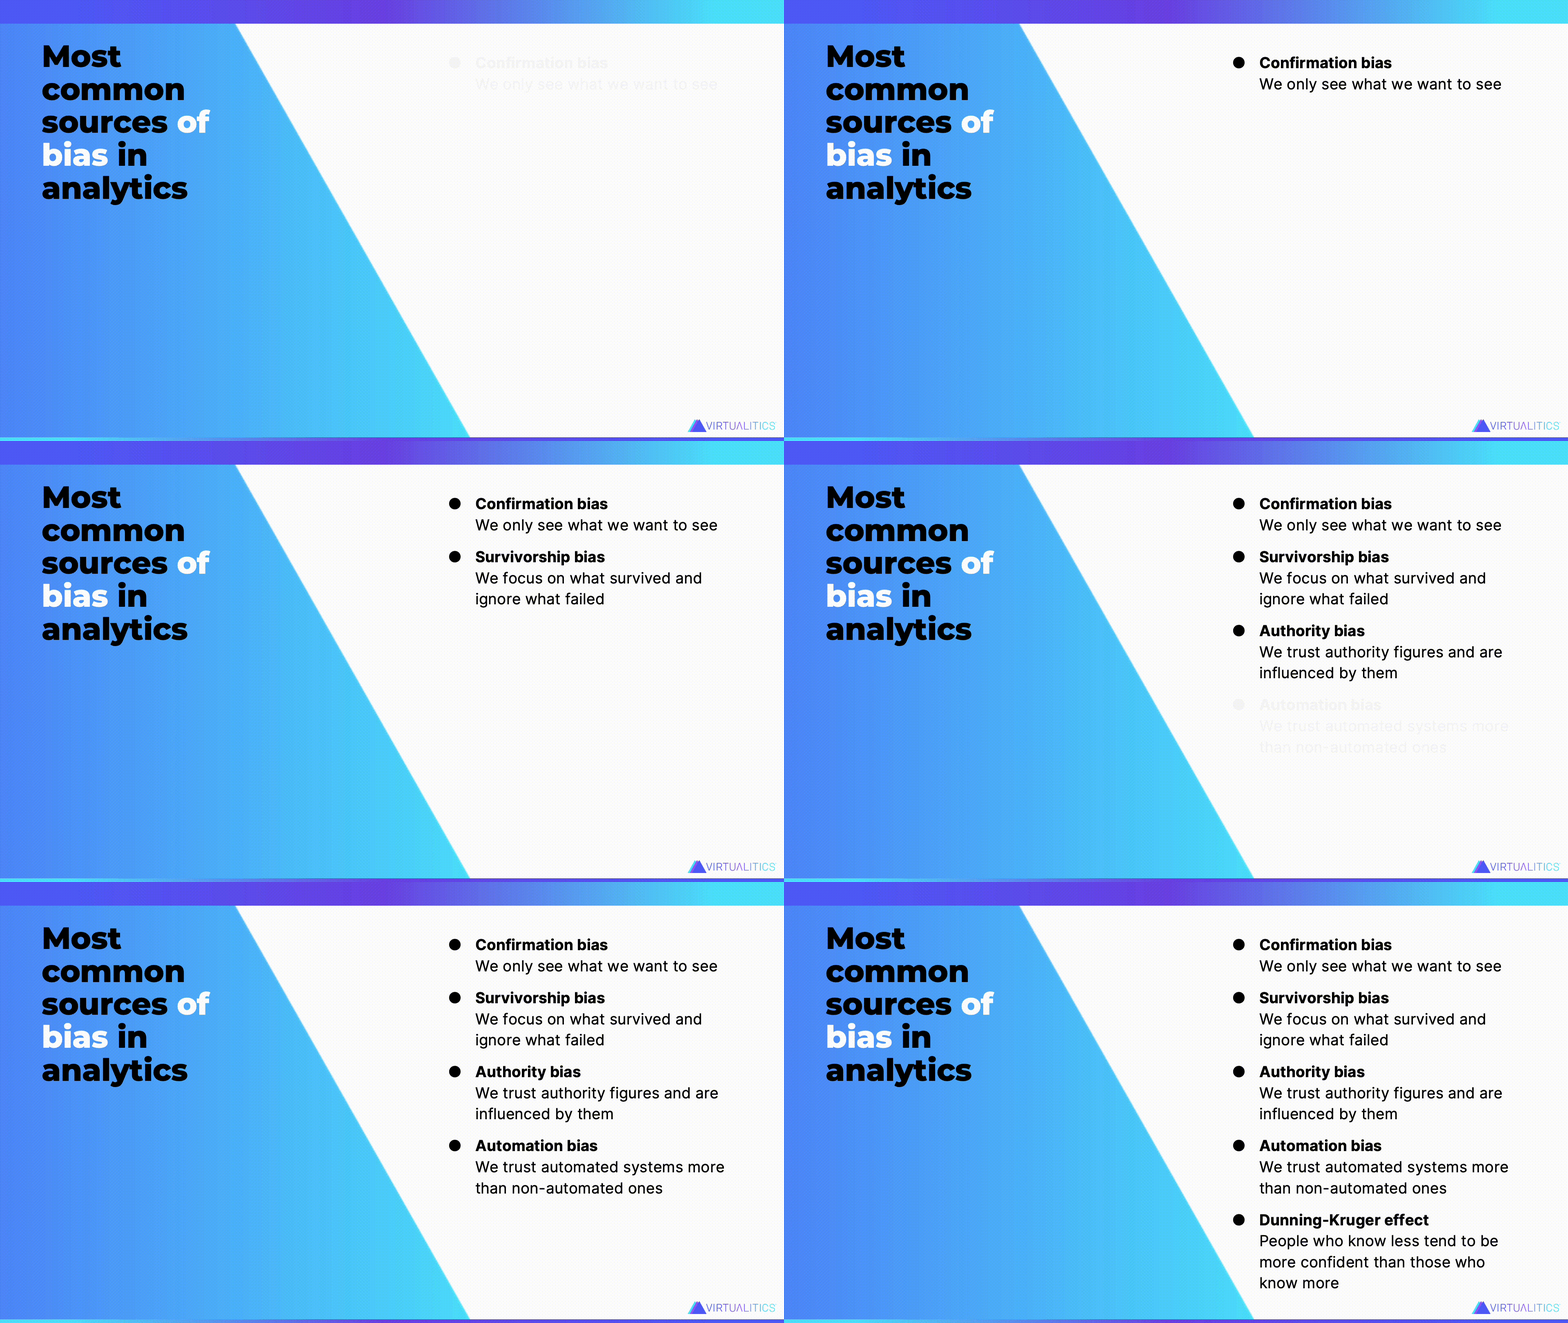 Tobias, You sent over what you think are the most common sources of bias in analytics. Would you like to talk us through them?
Tobias - Thanks, Caitlin, for handing that over. There are tons of different ways bias can happen or bias can be introduced into analytics. I'll just cover some of the most popular ones that I have seen. I think the most popular one is confirmation bias, which really means we only see what we want to see in the end.
There's a saying, if you torture the data long enough, it will confess eventually. So if you have a clear hypothesis and a clear idea of what you want to find in your data, you'll probably find it. If you have that assumption, for example, in the business context that a certain sales region is performing badly, you'll probably find some evidence for that.
The next one is survivorship bias. In data analytics, we often tend to just focus on things or objects that survived, or that came through a process. For example, imagine a funnel of customers. If you just look at customers who went through that funnel, you’re basically missing out on a lot of those people who didn't go through that funnel. And actually looking at those could be really… could really contain the information that you actually are looking for.
And the third one is something that we often see in big corporations and big companies and that's authority bias. There's a similar thing, which is called the HIPO–the highest paid opinion. It's very similar to that where we just trust authority figures and are influenced by them. So if we got any opinion from a senior manager, from someone who gave us the task to conduct an analysis and they maybe have some outcome they want to see, or they give you some hint of what could be there, we are just influenced by that.
And then on the other side, there's also automation bias, and I like to call that where the software or the system becomes the authority. I think a lot of us just know that when we just accept… if we use all the suggestion tools on our mobile phones to fix grammar mistakes and stuff like that, we just tend to accept that, right? And once we introduce those systems in analytics, it might happen as well. We just follow suggestions that some tool makes because we just trust the system.
Last, but not least, there's a so-called Dunning Kruger effect, which is a really big issue for data analytics. What this effect is is that people who know less, overestimate their capabilities and they tend to be more confident about their analysis. And on the other extreme side, there's also the effect that people who actually have a lot of knowledge or who know a lot, tend to underestimate their capabilities.
And you have the situation where you may have either young analysts or people who would look at data for the first time and they see signals everywhere and they think, oh, everything is so clear. Why has nobody thought about that? And so you have all those conclusions there. And on the other end of the spectrum, you have all those people who have maybe looked at this data for years who question everything. Who see a signal, but then, on the other hand, say Okay, is that really something, or should we really trust the data? You know, asking more questions. And navigating this spectrum becomes really difficult.
And I think those are the five most popular types of biases that I've observed and that I find to appear over and over again.
Caitlin - That's interesting. Do you find that people are really aware of these sources of their bias or does it take you pointing them out for them to become aware of it?
Tobias - Most people are really not aware of that, especially confirmation bias, which is so popular. But people just don't know about that, that they have their assumptions and they don't want to explore data. They actually want to have their idea or their hypothesis, confirmed. That's not data exploration, their exploration. If you have that open mind and if you want to generate a hypothesis, and not just confirm the stuff that you already have on your mind, it's okay to do that with data. But that's not data exploration.
So I think people are really not aware of those things.
Caitlin - I would agree. I've worked in the analytics space for a few years now and I've definitely observed, particularly amongst data analysts, this idea that we're data-driven, we're not biased. Very logical people. Bias is something we don't have. And that's simply just not the case.
Discover high-impact insight
So we're going to talk a little bit about discovering high-impact insight and how using AI in your exploration phase can help with that.
And I'm going to start with this question, and Tobias we'll start with you, how are current methods of exploration limiting potential? Why is it that the way we're currently doing things is just holding us back?
Tobias - Yeah. I see two trends here. The first trend is like the sheer volume of data. You mentioned that before, when we look at traditional or classical BI systems where we used to do that slicing and dicing of data for relatively small data sets. But even curating those small data sets, they have assumptions baked in. For example, the assumption of what data is actually relevant. But nowadays when we want to look at more data points or at more data sources, we also give more data sources to users and also more just tables and dimensions and fields to play around with. But who has the time to look through all those things? It's very time-consuming. And what happens is that people are just making their assumptions of what they think could be worth looking at. And many, many times they're correct. But in other cases, they are missing things. So I think the volume is one point.
And the second part is the complexity of the data. So data becomes so complex nowadays, not only when we talk about structured data, but also in terms of dependencies between different data points, which makes it really, really hard to comb through that manually. It's possible, but it takes a lot of time. And if there is one thing business users want nowadays, it's to have a quick time to insights and this is working against this. The challenges that we see are the volume and the complexity of data.
Caitlin - Absolutely. Aakash, what are your thoughts?
Aakash - I completely agree with everything Tobias said. I think one of the things I've observed a lot when, especially speaking of both business leaders, but also data scientists at both levels. Business leaders want dashboards with excessively simplified bar charts or just a line chart that points upwards. Tell me a good story that makes me feel good about what's going on, or shows that this is possible. Don't tell me something's not possible. That's not what you're paid for. And so, as a result, people–I like the phrase you used earlier–they're torturing the data. If you do it long enough, it'll eventually be forced to tell the story you want it to.
And so I think a lot of existing business intelligence tools are very much catered towards doing that type of thing. And the counter to that is not by creating very complex data visualizations or things that make it more complicated. It's just about showing the data for what it really is and accepting that some things may just not be possible. So I think a big part of it is oversimplification and, like you said earlier, hypothesis-driven. Telling people what they want to hear rather than telling people what's actually going on in the data.
And then the other thing is typically once you actually start to sit down with stakeholders and show them what really is going on, they actually like it and they say, it's nice that I'm hearing the truth for once. I don't feel like someone has put lipstick on a pig and put it in front of me.
Caitlin - Yeah, I totally get that.
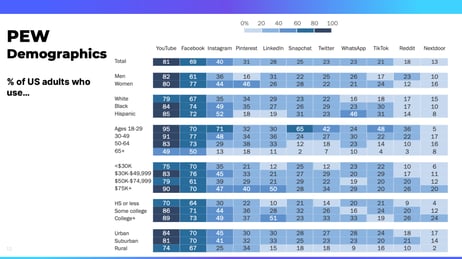
I wanted to do a real compare and contrast of looking at what you said, the complexity and the breadth of data, and how the current tools just really aren't necessarily all that helpful. So what you're looking at right now is a demographics chart of social media users. Pew Research does a ton of different research in the United States and around the world, and then they publish their results and they make their results publicly available.
So what we're looking at here is a breakdown of users of various social media sites, looking at their age breakdown, gender, ethnicity, income, and so on. And there's a lot of information here, but it's also not super helpful. They've tried to make it really simple, but in doing so, it really doesn't tell us very much.
But this is so often what we see; this is just a really classic look at it. And it's really limiting. So we're going to look at this information in a slightly different way, a little further along. But let's talk about a different way of looking at information.
 So how does introducing AI really transform your data exploration and how do you do things differently? How does introducing AI transform exploration? Aakash, I’ll start with you
Aakash - I think when it comes to using AI, like you said earlier, a lot of people think of AI more as the outcome or the output of what's going on, but you can actually use AI and automation to change the way that you explore the data. So the classic example, I see a lot, is people become completely overwhelmed with what's in the data and they start diving into rabbit holes and they sometimes lose sight of the big picture. Other times people are too focused on just aggregating, aggregating, aggregating, and they lose sight of some of those stories that are taking place that really drive the change.
And so AI kind of harmonizes a lot of that by allowing you to dig into the story behind each individual data point in aggregate. If a human does it, it takes way too long. When AI does it, it's allowed to move much faster.
And the other thing that AI changes is it can, if done the right way, actually explain the story to you. Most people are used to… They see data, you know, they're always expected to provide a story. They may not have a story, so they'll invent one. But that's not really necessarily what's going on. And so in this case, the AI can kind of help connect the dots a lot better and show more concretely what that story may be, or at least make it clear when there is a link maybe missing and further explorations required to figure out what's there.
Caitlin - Right. Tobias, what are your thoughts, what have you seen?
Tobias - Yeah, I completely agree. AI gives you two things; it gives you scale, and it gives you speed. And that's just what you need for quick data exploration. And by leveraging AI capabilities to really look at millions of data points and extract patterns and just highlight aggregations that might be meaningful to you. I think that's big leverage here. And what we should not think about is just letting AI do the exploration for us and giving us final stories or final insights. But what AI is doing–it's giving us suggestions, essentially like suggestions of what's in the data. What could be there, like making us offers to look more into things and also to apply human-based reasoning. Something that AI can't do.
And I think in combination with that things really, really get interesting where you can really do data exploration much faster on a much larger scale.
Caitlin - I totally, totally agree. In fact, this is something we feel really strongly about. Aakash, want to speak to what people are seeing here?
 Aakash - Absolutely. We call this intelligent exploration and really what that means–it's when you're allowing AI to do a lot of the legwork of the exploration. And it doesn't just change what you do during exploration, it changes the entire process. It provides a more robust foundation for the rest of putting AI into production.
And one of the keys here is instead of using hypothesis-driven exploration to limit your scope, you can let the data speak for itself. After all, that was the point of collecting all that data. I think a lot of times people have gotten so used to having to make a story, make a hypothesis, and then force the data to fit it that there's almost a reeling back of methodologies to, now that we have all this data, really let it speak for itself.
And intelligent exploration is a means of doing that and letting you tell–see–this data's story as it is organically. And the AI is really more there to display the results to you. Maybe point out some key findings or key insights that are significant. And then you can start to use your expertise as a human, as a subject matter expert, to fill in what the real story is going on. And then as for how that affects the downstream steps in the process. Now you've got that robust foundation, you know if a predictive model is actually needed, you know what hurdles you may face and how you may have to overcome that dirty data.
And you can also tell if it's not needed. Like sometimes you don't necessarily need to build an entire predictive recommendation system; a simple report or a flag being set is maybe all that's needed. And then finally for executives, their buy-in is so important in getting a project to production. And they are very used to saying, well, it has to work because you know that these are the options in front of me. But when what's put in front of them is actually grounded in the realities of the data. It's accounted for how dirty the data may be or, or missing pieces of what's in the data. Then when, by the time they're actually giving their buy-in, it actually really enables the data scientist to work on a project where they're not going to have to be faking it to put in front of executives.
They can actually work with the data as it is and still drive impact.
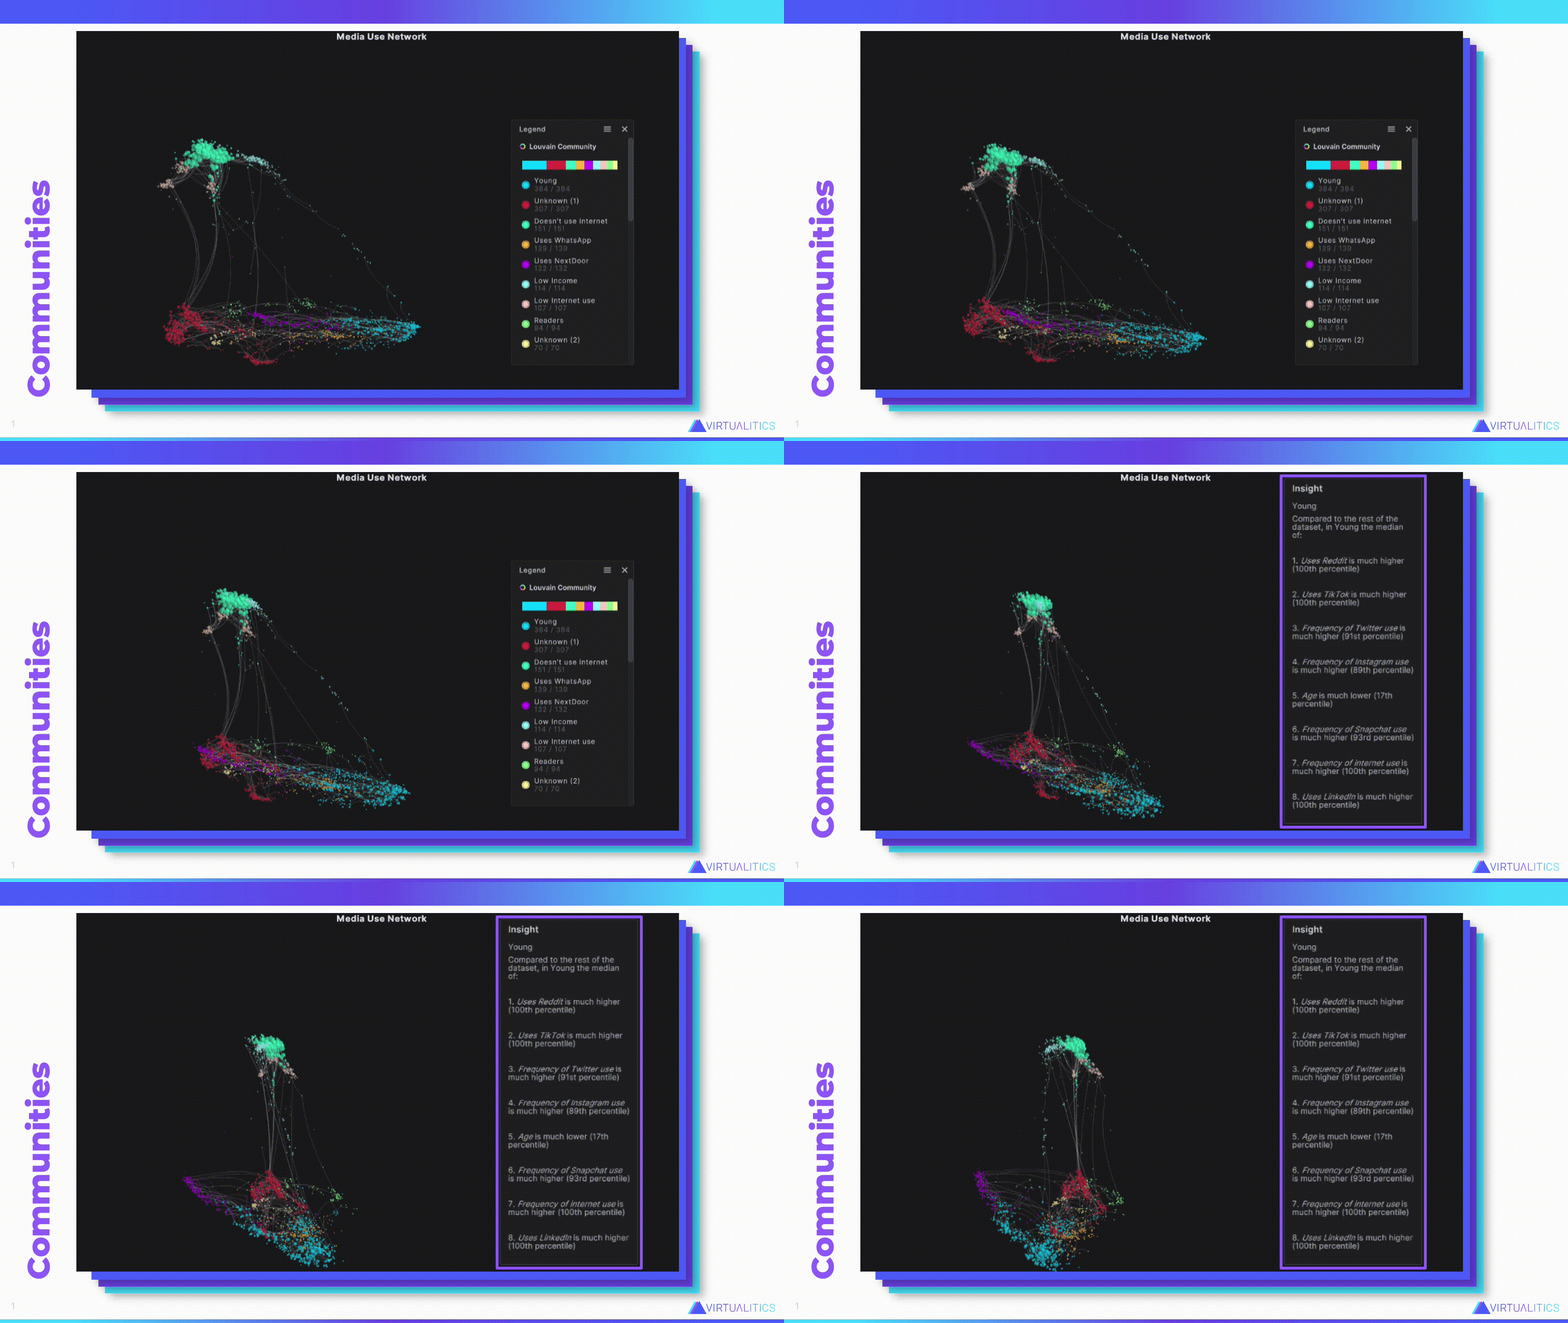 Caitlin - Let's look at one of the things that AI can do. Aakash, do you want to tell us what we're looking at?
Aakash - So this is actually that same data we were looking at that was in that table structure. But now instead of aggregating it, we're looking at each data point. Here is the individual story behind every one of those participants in the research study. And so what we've done is we've taken completely tabular data and we've run it through our network extractor tool, which looks at the combination of different attributes behind each of these individuals and identifies how they're related to each other in terms of shared and rare attributes. So, for example, few people are readers–in this day and age reading has become something that's a little bit more rare. So, you know, people that actually read, they're going to show up more closely together in this network graph.
Once this network extractor is done, it creates this network structure that wasn't there before, and it labels communities. Now you can start to see what's really going on. And that goes much further than just seeing what was showing up in that table where it was just a bunch of numbers. Now you can see how there are these different relationships, who's close to who, how those communities are maybe interacting with each other.
Caitlin - I really like this information because actually that table I showed earlier, with the demographic information, that wasn't even all of the information that was gathered in that survey. But this network graph was able to take all of that into account. Like you said, it found who are the readers, and actually you can see the readers are that light green group down at the bottom. They're still down there with the internet users. They're not not internet users. So you can get so much more rich value out of it. And the AI also is able to give us a bit of insight about the particular group as well.
So this is about that Young, light blue group down at the bottom characterized by their youth. But also, as you can see, the fact that what is significant about this group–they're significantly different from all the other groups–is their use of some of those social media platforms. And this was all generated by the AI. So the AI was able to make sense of all that data and then feed it back to us in a way that's easier for us to consume.
Uncover viable, useful use cases
 Caitlin - Let's pose the question Why should analysts be changing how they explore for AI use case viability? Tobias, let's start with you.
Tobias - I think one of the things that you also showed that network graph before, I think what's possible now is you can do those analytics and you can apply those techniques, even if you're not a data scientist. So I'm actually applying or talking about this a lot in my book where I say that if you are a business user, if you are a user who has a good understanding about the data itself and a good feeling for what you actually want to achieve in the end, there's a wide range of tools available for you to just apply them and apply AI to the exploration process. And this wasn't actually possible quite a few years ago. Technology wasn't ready yet. But now we have this available and it's pretty easy to use. So I think that's one thing that is changing here and once you are able to look at huge data sources and at a lot of data points, then eventually you also have the fundamentals of building more advanced AI use cases in the end. Because you just can't build AI use cases when you're just looking at small tabular data sets all the time. It doesn't work. You need large data sets in order to build your own custom AI services.
Caitlin - Aakash, what do you see?
Aakash - I agree with what Tobias said there. I think another reason is because people are so…like they're used to prettying up the data and a big issue is to build a real predictive AI system, like a recommendation system.
You need to be able to deal with that dirty data and to be able to do an exploration you need to look at the data the same way that a model's going to look at the data. Because the model has to deal with that dirtiness, the missing data, whatever the issues are. And if you're not exploring, accounting for it the same way, then you're basically looking at everything with rose-tinted glasses. So by looking at the data for what it really is, that actually increases the viability of whatever use case you're trying to develop.
The other thing is by baking AI into the exploration process, you're also starting to validate that, okay, I can see a clear separation in my two categories, my two segments. Maybe, now that I can do that, now that I can even annotate or generate segments automatically using AI labels, I can now say with some level of certainty that, okay, I was able to do it in exploration. That means there's a better chance we can do it in production.
If you can't even do a simple version in exploration, it's not a very good sign. And that's a point where you should tell yourself to pump the brakes a little bit, maybe revisit, okay, what additional data do we need to collect to make this more feasible?
Caitlin - All really good points. And, Tobias, when you mentioned that it's really hard to see the interconnectedness in a bunch of Tableau tables. I have to imagine that it's even that much harder to, if you did think that you found something, to then explain it to the stakeholders who need to buy into it and hope that they see it too. Is that true?
Tobias - Yeah. Especially enterprise or B2B data. It's so complex. And a lot of times people are looking for easy explanations and easy things that are going on. And in most cases there's also this…but so we see this and this. There's also this to that.
And I think you have to find that balance between having a clear message and a clear story, also a clear outcome. But also being that, just being aware of all the things that could go wrong. And especially for AI use cases, like if you are building your own predictive models, and Aakash, you mentioned that if you don't really get the basics right–and in this case, it's your data and the understanding for your data right–your model won't work in the end.
The typical garbage in, garbage out principle totally applies here. So that's why I think it's really, really critical to spend time at the beginning and explore your data and find things that are going on, but also find things that are maybe missing there. Or things that are not looking right. Or maybe they could be indicating that there are some flaws in your data that you need to fix. And I think this is really, really, really important because in the end, if you have an AI model, this model will just do what it has been trained to do. It doesn't think about data.
Or it doesn't interpret the data. It just does what it has been trained to do. So it's your job as an analyst or as a data scientist to build these models to do the thinking actually. I think AI really gives us the opportunity to focus more on that thinking part. And let this whole… discover patterns and data and correlations and segments. And we think, no, just leave the computer to a little bit to a certain degree and just validate those findings and apply your human knowledge and logic to it.
Caitlin - Oh, totally agree. You know, Akaash said something to me before about this. That sometimes there's this feeling when you get to the end of the exploration phase and you haven't found something, you haven't found anything viable and there's this temptation to feel like you failed. But when you frame it as “this is actually success”, because if you had gone forward with something that wasn't viable, but you've gotta push forward with it anyway, because you overlooked something, you have magnified that failure and put it into production. It's actually a huge success to realize that you don't actually have… there's no there there, and that's a success to realize that.
Aakash - I think especially when you're working with high-risk scenarios, high-risk applications of AI, a good rule of thumb is yes, try to do smart things, intelligent things, but definitely, as a first step, don't do anything stupid. And the way you do that is really exploring your data and making sure that there's nothing that could become a real issue in production.
Remove biases from your exploration
Caitlin - All right. So on that note, let's talk about how we can start removing biases from our exploration.
And so let's start with, how does AI-led or intelligent exploration remove bias. Tobias, we'll start with you.
Tobias - So I see AI during explorations as something like my co-analyst. Something like a colleague that is like helping me to do this exploration. And by just showcasing or surfacing what things are going on in the data, it kind of mirrors my own biases. Maybe these are things which I have thought about. Maybe they're just there, and it's not really a bias in that respect, but maybe it's showing me something completely different. And then I suddenly realize, okay, Hey, I had this confirmation bias or survivorship bias here in that analysis and AI actually made some suggestions for me, that there might be some other things going on in the data, which I wouldn't have thought about. So I think this can really help to mitigate the overall effect of bias and new exploration.
Caitlin - Yeah. Aakash What are your thoughts?
Aakash - I really like the way Tobias kind of broke down the different types of bias. The way I've always thought of it is there's kind of two classes and maybe the ways he was talking about fit into these. So there's the human-based bias of… confirmation bias where you think you know how things work. You have a certain story or narrative, you want to be able to tell with the data and you're introducing that bias to the situation. The other type of bias is the bias that lives in your data. So that is where–we've talked about this before, Caitlin, right? So there could be bias baked in at the data level, whether it was how people input the data themselves, or even biases at the sensor level or just generally part of your data collection.
And so when you're using AI-led exploration, those biases that live in the data immediately get uncovered and you are forced to kind of reckon with them and, and figure out, you know, what part of it is actually something that needs to be accounted for, what part of it is acceptable. The other thing is when, in dealing with your human biases, we see this a lot. People have really grandiose ideas of what they're going to do with the data. And when they actually see it, they may understand suddenly that there is a lot more noise in this data than we previously thought. It's not as clean of a story and so that immediately is contradictory to the story they want to tell and so that bias starts to erode as well.
So in both cases, there are ways where the AI can uncover bias by showing you something that may not necessarily make sense. And the reason is that bias exists and other times it may be that it's showing you what's really there, and that is contradictory to the biases you already have.
 Caitlin - We've talked about using intelligent exploration, but I know there are data scientists that do use AI to explore. They are often models that they've created themselves. How can we expand the use of this? How can one individual keep pace with demand? And I see that demand for data scientists in general just keeps going up like 10, 20, 40% year over year. So how can they keep demand with the exploration and all the other work that they have to do? Aakash, we'll start with you.
Aakash - So I think that first and foremost, how do you keep up with the demand for data scientists? You don't. You have to introduce the skills and capabilities that can be responsibly farmed out outside of the data science community to analysts, business analysts, and business stakeholders, and that's exactly what intelligent exploration does. It's taking those AI capabilities, those modeling capabilities, that previously were kind of gatekept by data scientists, unintentionally or not, and now make it easy for everyone to be able to apply those and understand what's going on. And understanding what's going on is such a critical piece of that.
It's not enough to just put a model in front of someone or just put results in front of someone. It has to be paired with an explanation. So there's no way to keep pace with the demand for data scientists. You’ve got to flip the problem and use this intelligent exploration to farm out those capabilities. The other piece of it is just in terms of the scale of data and complexity of data, that's always growing, always getting bigger. That is where if you rely purely on human-based hypothesis-driven exploration, it's a very manual process. It takes a lot of time. Especially when you have to torture the data to tell your story, that takes even more time.
So intelligent exploration really kind of cuts past all that and just shows you what's really there and adds a layer of automation that can accelerate everything you're trying to do.
Caitlin - Tobias. What are your thoughts on this? What have you seen to be successful?
Tobias - I think exploration needs to scale over subject matter expertise. I mean, you can try to hire more data analysts and more data scientists, but the problem is if you hire them externally, they probably don't have the subject matter expertise that you actually need. And these are the things which you have in your business and where technology can actually help to just apply the things in the head of your employees to data and let them work with data themselves.
I'm not saying you should just give every business user an AI service and they'll just figure it out. That's not the case, but we just have to acknowledge that in businesses, there are people who have been working with data sometimes for decades. If you look at traditional BI departments, for example, and in many companies these traditional data folks and people who are data scientists or machine learning engineers, they often live in two different departments, maybe even business units, and they don't talk to each other.
And I think we need to give more of those data science capabilities to people in organizations that can actually apply them in order to do those explorations. And I think in the end, it's a journey where companies have to start and they need to scale those competencies or this level of data literacy across many, many more employees. But of course, that takes time and it doesn't happen overnight, but you need to get started with that. And I think this is where technology can actually also help.
Caitlin - I totally agree. I have a background in change management and in change management, when it comes to data analytics, there's just reluctance to use analytics because people don't understand them. But if you don't use them, nobody understands them. So you have to expose people to analytics and analyses and get them used to working with data in order to build that competence.
Tobias - And some people have that… it's also a form of bias. They think I'm bad at math and I'm bad at statistics. I'm not good at working with data,” but that's not how it is. In the end, it's about applying logical thinking and about applying analytical thinking. And of course, statistics is a part of that. But when we talk about data exploration, we are not talking about making inferences and talking about P values and whatnot. We were talking about understanding what is going on and we need that knowledge from business people or subject matter experts, whatever you call that, we need to apply that to data.
Every time I hear people say, Hey, I'm not that data person. I'm like, okay, let's find that out. I challenge that.
Caitlin - I feel that in a way you probably don't understand. I had to do a year of statistics for my undergraduate and I scraped by the math part just by the skin of my teeth, but I understood the principles of it. And that has been incredibly useful. You can understand one part of it without maybe getting the math side of it. And you're right. We should be building that confidence in people and building their confidence in it because it just is necessary in order to operate.
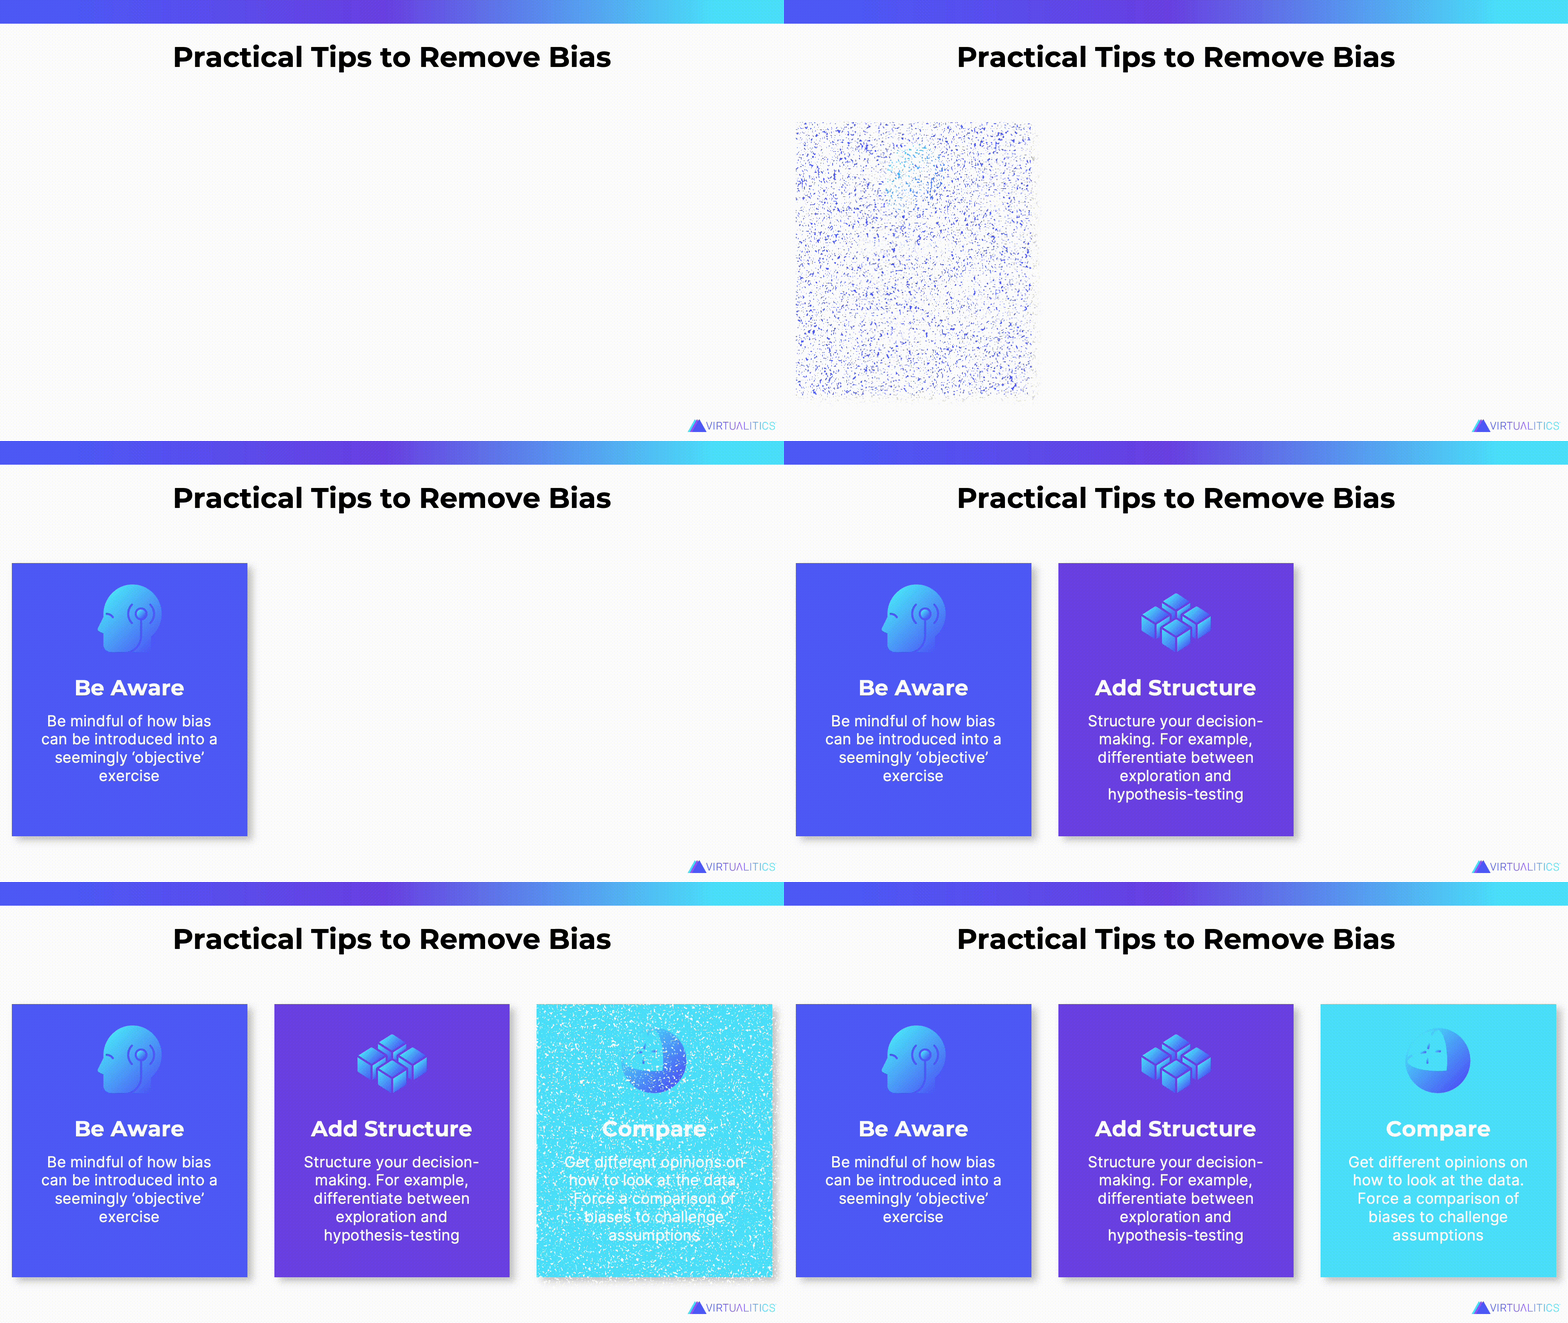 Let's take a look at practical tips to remove bias. Tobias, do you want to walk us through these?
Tobias - The first one is be aware. Be aware of your own biases. If you don't, if you have never heard about confirmation or survivorship bias, it's really hard to recognize them. So first of all, just be aware of the different kinds of biases that could occur.
And the second one is to add structure to your whole decision-making process. For example, of course you need to do data exploration with an open mindset, but in order to do that, you need to be able to differentiate between exploration and hypothesis testing. These are two different things and they have two different goals in the end. And you need to be able to just map that into your thinking process.
So you don't want to use exploration to essentially make a decision at the end necessarily. That's just far more at the beginning of the whole spectrum. So you need to just logically structure your thinking and just find out, okay, well, what am I doing, actually. Am I really looking for a certain action? Like, do I need to decide right now if the button on the website should be green or blue, or if I should send a customer an email or give them a phone call. That's a clear decision-making problem, but that's at the very end of the analytical spectrum.
At the beginning, you just start figuring out, okay, what are actually problem areas? Where can analytics actually help? And I think having this structure also gives you the confidence of looking into different things, and then being aware of the biases that could be happening in those areas. And last, but not least, just compare your own opinions against other opinions. And these could be opinions from colleagues. The way that you look at it, data, at a dataset, just challenge that with other colleagues or with other people, or of course with AI.
I just like to refer to AI as my analytical companion or my co-analyst and say, Hey, what's the, what's the opinion of that software here, and in that respect, I can completely just disregard that whole thing or this opinion, or just say, Hey, that's rubbish, just completely wrong. Or, you know, maybe the data is wrong. But I have that opinion. And I actually can compare what I think about data to whoever is giving it to me.
And I think the worst part we can do is lock ourselves away. Just don't talk with anybody for two weeks and look at the data and then have the goal to come up with a final conclusion in the end, after the two weeks process. So that's not how it works.
So always try to compare and see how your thinking process actually compares to other people and to other people’s opinions or to the opinion of software in that respect here.
Caitlin - And that's why I actually think it's really great to get that alignment with the business, because, something, a pattern, that you might spot that you're desperately looking for, some kind of business reason for it, and they might have it at their fingertips because it’s something that they've observed and you're kind of validating it or, or challenging it.
Aakash - I would just add, I really like the three tips here. On that compare; I think of it as both compare and collaborate. And I think that was kind of the spirit behind which you were saying it, as well. We place a really big emphasis on this, both in our tool and in terms of when we're providing solutions for our customers. I like how you framed it. You're collaborating both with your other subject matter experts, but you're also collaborating with the AI. Like it's sort of another character in the analytic journey and–or like a co-pilot in the whole thing–and so that being able to compare what you are coming to, the process with what the data is immediately showing through the lens of a model or AI, and then having it all in a tool where it's easy to kind of tell the story with. The data that's really there to make it something where it's easy to collaborate. You can actually all look at it at the same time. A super important part of the process.
 Caitlin - So we said we've had some questions come in, so let's take a look at them. “What about the danger in people using tools or data that they don't understand?” Tobias? Do you want to take that one?
Tobias - Yeah, I think the worst thing that can happen is if you apply a tool to data that you don't understand and just expect a tool to solve everything for you. That's not how it works. Like the worst thing you can do, actually. The best thing you can do is actually to have some basic understanding of data in terms of–and I'm not talking here about mean values and averages and, the top quant and whatever–I'm talking about the whole data generation process that you're looking at.
What is that artifact of reality? What did we measure? What do we have, what do we not have? Just having this semantic understanding of what you're actually looking at. And if you combine that with technology, I think it brings patterns in the data to your sight. And you'll just be able to interpret that. So, you should have an understanding of the data, and of course you should have a basic understanding of how the tool works and what the tool is doing. It's not autopilot. It's, a co-pilot, I think that's a very important differentiation to make.
Aakash - I think that's a great way of putting it. And there's a reason that, on an aircraft, they don't just let you turn on autopilot. You have to know how the plane works and how to fly it. I think it's so critical that explanations are built into the tool. The tools have to know that you may not know how this works. So let me explain, what is the insight here? How did we get to it?
And make it visual all the time. Because if it's not visual, people aren't going to be able to track it. So providing the insights and providing easy-to-understand explanations at all steps is super critical. And that goes alongside everything Tobias said.
Caitlin - Next question. I love this question. How do you approach a business leader when the data does not support their hypothesis? How do you let them down? Who wants to go first? Who has some advice?
Tobias - You better go on holidays
Aakash - Run. It's run. I can take a stab. So I think the first thing is you should never be afraid to approach a business leader. I don't think that's ever their intention. I think they're looking for success. However, with high-risk applications, the only thing that can be better than doing something, improving on a system, is to stop yourself from doing something that could be catastrophic. So don't view it as letting them down. View it as, Hey, I'm coming to you right now, before we start running away with a pipe dream, to tell you this is not possible. This is not a good idea. It is error-prone, failure-prone, or high risk. Here is the evidence for why. And I promise you, they will appreciate that you are doing that and coming to them early with that rather than coming to them late. Then they've gotta say, well, we've already invested all this time and money into it. Well, why are you telling me this now? How do we get ourselves out of this hole?
So if you come early with that information, it also then escalates when you come to them with maybe more positive news, that we've got something that really could work. That makes that seem way more valuable. The highs are higher when you've shown them all the lows and things that won't work.
Tobias - Just one thing I can share from my personal, practical experiences; the way you communicate that also matters. So I would not recommend breaking that news in a presentation. So don't do a presentation with 20 people and just say, Hey, I basically just negated everything that you knew there was, and that basically was the scope of the whole project. But try to engage them one-on-one. Try to have those more intimate conversations before, and early on, in order to have that discussion and feedback, because there could be a reason why these things are happening.
Or maybe you have a solution, what you could do in order to maybe turn that around or maybe reformulate the problem, or something else. But you want to do that really, really early on. And from my experience, I can say do that in a one-on-one discussion and don't have too many people involved in that discussion. Just because it might eventually lead to the point where business decision makers or managers have to just acknowledge that they had a wrong assumption about something and that's not always an easy discussion to have.
Aakash - No, I would also emphasize, like you said, don't just go to them with, Hey, this is a problem. Go to them with, here's why maybe here's a potential solution and some options that we could explore.
Caitlin - Great approach. We have a question about the best approach early to using analytics and AI with groups that have a very low maturity and data knowledge. Tobias, what have you seen work?
Tobias - What I have seen really work well is to use Q and A for data exploration. Really not data exploration, that's wrong, but for basic descriptive analytics.
So meanwhile natural language processing, or NLP AI, has become really, really mature, at least for English languages. And if you have a dashboard where you just have basically a prompt, like a search engine, where you can just input some query and you want to just find out how sales data was last year compared to this year or how sales data was in a certain region, that works pretty well out of the box in popular BI tools.
And that's actually AI at work here. And it doesn't always work immediately, out of the box. So you need to do some little customizations here and there, but it's essentially a very, very good tool to tell people, Hey, you know, we are not that mature as an organization in terms of analytics, but actually we are using AI to do that. And this kind of gives you confidence also to maybe apply more advanced techniques or more advanced concepts. So Q and A and just exploring your data using language, I think that's really cool.
Caitlin - Yeah. I think in practice, I think somebody's just giving people practice.
Tobias - Yeah, everyone talks about AI, but I think people have to just try it out and see how it works for themselves. And they might find out that it’s too complicated, doesn't work for me, and might just have like 20 rows of data. It's too small for AI. That's fine. But the entry barrier for using AI services nowadays has become so low. In the end, I think it has to do with a mindset. It’s actually a mindset problem.
People think they are not ready for AI so they think, okay, this is just for the nerds. This is just for the IT people. I'm not in for that. But I think that's not the best way to think about that at all. So you should try to get hands-on with these technologies.
Also knowing your capabilities or your abilities. The Dunning-Kruger effect kicking in here. Not using AI services. And then coming up with a ton of different conclusions where you say Hey, I found the truth. So I think that's the challenge here, but basically getting hands-on early. That's great.
Aakash - I know it can seem scary, and again, this comes back to people really thinking AI is just about putting a recommendation system, a predictive system into production. This is exploration. It's not going to hurt you. No matter what you do, it cannot hurt you. All it can do is give you better information. Maybe make it more clear what you need to do, what are some things you need to still do further exploration into?
Caitlin - Yeah. And so as a lay person who doesn't understand math, I would also say give them some guidelines. Like what does significant insight really look like–how big of a correlation should there be? Just some checkpoints so they can validate, did I see something or not? And break it down for them without the math.
Finally, in the last couple of minutes we have left, a question about data. What can you do when your data sucks.
Tobias - Get more data.
Aakash - And you know what, Tobias? Any answer other than that would be lying to you. But what you can do is qualify that, quantify that. Why does your data suck? Is it missing or are the values just incorrectly put in? If you can qualify and quantify how your data sucks, that at least gives you some information to go to your stakeholders, to go to your leadership and say, our data is not great. Here is exactly what we mean by that. Let's make a plan to correct that wrong. Because the answer has to be, you just need more data, you need to collect more data, but ‘how’ is the part that leadership will care about.
Tobias - Yeah. The point I also want to make was ‘get more data’ is like one problem because everyone's complaining about low data quality and things like that. The problem that I see is that we try to apply advanced techniques to data that has been collected historically for totally different use cases or scenarios. So we just have a bunch of transactional data, maybe aggregated somewhere. Now we want to apply AI in order to build a model on that. And often that doesn't work. So just collecting data intentionally with the idea of having some use cases in mind or on the backlog of some things that you could do later on. I think that that's really key. So a good example is Google maps.
Or Google street view. When Google started street view, I think 10 years ago or so, they didn't just capture street images, but they captured those images in full HD. Basically in the maximum resolution possible. And everyone back then would've said, why do we do that? It's just a bunch of additional costs, costs a lot of storage, it costs a lot of money, and people don't really care if the street picture is a bit blurry or not. But actually what happens now is they can use this old data, for example, to train machine learning models. To train models to recognize traffic lights, to recognize street signs, to use that for autonomous driving, reutilize this data.
And I think this approach here is really important to think about why should we use that, and why should we collect this data, and how we could use that in the future for future use cases. So that's what I also mean with you just collect more. Don't always do the same thing that you are already doing, but broaden your scope a little bit and see what kind of data can you collect. So I think that that's also critical.
Caitlin - That's really great. Thank you so much. And thank you for being on this webinar with us, Tobias, it was really great to have this conversation with you and get your perspective. Enjoy the rest of your day.
Tobias - Thank you very much.
Aakash - Thanks, Tobias
