
Written by Ciro Donalek
Oct 26, 2022 6:15:00 AM
Multitasking? Great! You can listen to this blog post by clicking above or find our podcast, Intelligent Data Exploration, on major podcast platforms.
Our mission at Virtualitics is to help teams explore and experience their data without limits so that they can find the insights that will change their business. And as the chief technology officer, I oversee the development of new technologies that will deliver on this mission for customers. We’re always looking to solve these complex data challenges in ways the industry hasn’t attempted. That’s why I am proud to share that Virtualitics was awarded its fourth U.S. Patent for Systems And Methods For High-Dimensional 3D Data Visualization.
Virtualitics was started because my co-founders and I saw that the promise of AI was being held back by the tools being used to explore and understand the data. We designed the Virtualitics AI Platform to explore complex data sets for the purpose of creating and deploying business-changing AI workflows. We believe that good AI applications need to be based on a thorough exploration of all the relevant data to ensure responsible, impactful AI and so we built AI into our platform to power what we call Intelligent Exploration.
Intelligent Exploration uses AI to explore, visualize, and interrogate data, allowing data scientists and analysts to build models on a solid foundation. The innovative features that we build into our platform to support this work are so unique and progressive that Virtualitics has been awarded four U.S. Patents.
Intentionally Innovative
One of the things I’m most proud of as Virtualitics CTO is making innovation a core part of our development cycle. My team and I are always looking at how we can move the practice of advanced analytics and AI forward through the capabilities of our platform. As we start to build out our solutions, we also assess our work to identify what is 100% new to the market (in the context of patents, this is called being novel and is a requirement for being granted a patent.)
It can be difficult to articulate how software offers unique value. Often things are “better” or “faster”, but rarely new and different, addressing new, or underserved challenges. Quantifying innovation and new ideas is a challenge. Our patents protect our intellectual property, but they also illustrate that our technological advances and capabilities are unparalleled.
Intentionally bringing innovation into our process has served us well; with five patents, we’ve made outstanding progress as a fairly young company.
Our Patents
Our patent portfolio continues to grow alongside our technology, building upon each other as our technology advances. Our combined patents represent the most innovative and impactful parts of our platform in four main areas of AI and data analytics: 3D visualization scalability, creating a fully collaborative platform, AI-guided exploration, and network graphs.
3D Visualization and Scalability
The amount of data organizations are gathering is growing exponentially–it’s now much greater than traditional, 2D Business Intelligence tools can thoroughly explore. As a result, data scientists and analysts either get bogged down trying to assess everything with old techniques or scale back their exploration. Both introduce risk into their projects. Effective AI should be based on the thorough exploration of all the relevant data to discover the meaningful drivers, the best targets, and to properly assess the quality of the data to mitigate risk.
From our earlier research at Caltech, we knew that this kind of exploration of complex data sets was best done with 3D visualizations. Multidimensional visualizations can show more complex analyses and enable the user to look at them from different angles, facilitating discovery. We wanted the user to be able to generate powerful visualizations quickly and pivot them, drill into them, and replot them seamlessly, so that the focus was on finding insight, not waiting for the image to reload.
To provide this experience, we developed specialized data structures to optimize the handling of large data sets for processing on GPU. This method allows us to render and interact with high volumes of multidimensional data points in 3D and immersive environments. Our approach enables browsing data at a high frame rate, and users are able to seamlessly interact with them in a native 3D environment, whether it’s on a screen or through VR.
Collaboration
Collaboration is a huge part of any successful AI or data-driven strategy. Whether it’s working with fellow data scientists or analysts, subject matter experts who can add critical context, or bringing stakeholders up to speed, collaboration is key.
We developed a collaborative framework called Shared Virtual Office that allows multiple users to collaborate using our 3D visualizations and embedded AI in real time. The Shared Virtual Office is available through both our desktop environment as well as in VR, or both during the same session!
Network Graphs
Graph analytics has existed for a while now, but the complicated technology stacks and data science required to create them has kept adoption low. Moreover, the resulting 2D visualizations usually fail to accurately communicate the relationships captured, and take a long time to render. Flattening a visualization that uses proximity between elements to denote relationship status can’t properly capture those relationships.
But we knew that network graphs needed to be a key tool for any data scientist or analyst who wanted to discover the relationships and dependencies in their data sets. Data-rich network graphs enable teams to identify root causes, manage risks, and make impactful decisions based on the communities and behaviors they discover. We needed to make them accessible.
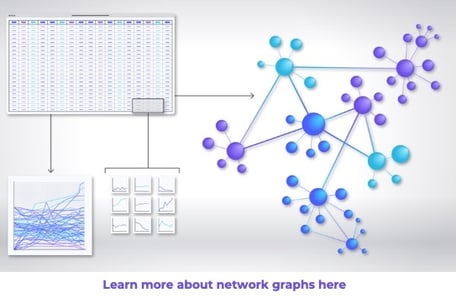 We developed a no-code AI algorithm that extracts relationships from tabular data sets and generates a 3D visualization of that network graph. We are the only platform with a network extractor, and ours is designed so that both categorical and numerical values inform the relationships. We also created a GPU-accelerated 3D force-based graph visualization algorithm with AI-enhanced initialization to ensure peak performance of the graphs as they are generated and as users interact with them (up to 100X faster performance over open-source and other solutions)
AI-Guided Exploration
Finally, we wanted to ensure that complex data was explored thoroughly. Exploring complex datasets can be time-consuming, requiring specialized skills and experience. And even when you have all of those things, it can still be possible to miss critical insight if you don’t know where to look for it.
Our AI routines automatically calculate ranking metrics for data features in any given data set and generates the right multi-dimensional visualizations to illustrate the most important findings. What this means is that an analyst or data scientist can access a large dataset containing thousands of features—for example, a rich dataset of buyer behavior, or every scrap of data about mission-critical machinery—and simply ask questions about what’s driving one of those features such as “What’s driving amount spent?” or “What drives unscheduled maintenance?”.
The AI combs through all of the data attributes in the set to find the drivers, rank them, and generate multidimensional visualizations such as scatter plots, histograms, time series, or geospatial plots, based on the main drivers found. Depending on the characteristics of the features, our proprietary method assigns the various dimensions we support to the most ideal and substantial 3D visuals to enhance understanding. For example, on the axis, a specific color, scaled size, identifying shape, halos, or shown over time–our Intelligent Exploration selects the one that shows off the insight best.
But we didn’t stop there. We also enhanced the AI routines with AI-generated Insight that calls out statistically significant insights, making expected impacts and potential biases clearly visible to all users regardless of their data literacy. This feature ensures that user attention is drawn to what matters and that their conclusions are more trusted and reliable, helping ensure your AI program stays compliant and responsible. Explainable AI (XAI) is a must-have to ensure trust and adoption of advanced data analytics and Machine Learning.
Future Innovations at Virtualitics
Each of these innovations work together as part of the Virtualitics AI Platform to provide unlimited data exploration, engaging multidimensional visuals, and a collaborative space where data scientists, analysts, and business leaders can strategize together. Learn more about the Virtualitics AI Platform and how we’re combining these patented tools into an industry-leading product here.
The innovation cycle at Virtualitics continues with several more patents at various stages of the process. We are passionate about the advances our team is making, and we look forward to seeing how teams put the Virtualitics AI Platform to work.