.png)
Written by Virtualitics
Nov 15, 2022 1:11:29 PM

Multitasking? Great! You can listen to this blog post by clicking above or find our podcast, Intelligent Data Exploration, on major podcast platforms.
As the Head of Product marketing at Virtualitics, I am always curious about how data scientists explore their data before deciding how, or even whether, to tackle an AI project. Understanding data quality, outliers, and whether you’re targeting the right problem before you start down the road to model development is a really important first step.
A couple of weeks ago I took to LinkedIn to get some answers. I posed a simple question in a couple of data science groups I belong to asking data scientists how they learn more about the nuances in their dataset before embarking on an AI project. The options were: Explore the data in Excel; Explore with visualization tools, Explore with a Python tech stack, and Leverage past experience.
The combined results (out of 1113 responses) looks like this:
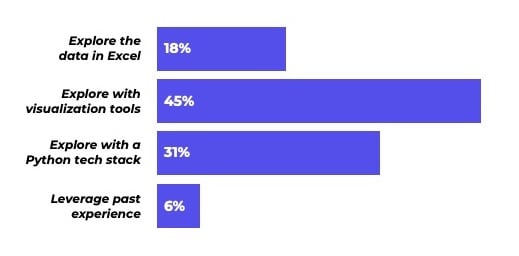
While a sizable number of people are still leveraging Excel to do exploration, visualization tools are the clear leader, followed by Python.
The reliance on Python is no surprise–as datasets get increasingly complex, data scientists need code, AI, or some form of computer assistance to figure out where they ought to be looking. But visualizations are still absolutely critical to bring clarity to the exploration.
The challenge for a lot of data scientists is that they have to choose between the two approaches and there are drawbacks to both. Relying on traditional BI & visualization tools means doing more simple analysis of subsets of data and then trying to knit together a conclusion.
Using a Python tech stack means firstly having a comfort level with the code and knowing that you’re using the right algorithms to explore. Then it’s selecting which insights to illustrate for discussion. But illustrating all of the AI’s findings to fully interrogate the insight is still out of reach. Additionally, finding the right means of communicating these insights to non-technical stakeholders without introducing confusion is still required.
At Virtualitics, we’re bringing those two elements together so that data scientists do not have to compromise between those two options. We’ve built an AI platform around what we call Intelligent Exploration–AI-driven, AI-guided, and AI-visualized exploration of vast, complex datasets.
Data scientists get the benefit of an AI co-analyst to help them uncover and explore complex data insight visualized in next-generation, true 3D visualizations that clearly illustrate the complex relationships discovered by the AI. This out of the box capability also puts data science power into the hands of data analysts. They can do some of the preliminary work, leveraging AI-generated insights to draw attention to areas of significance so nothing gets overlooked and relieving some of the pressure on overburdened data science teams.
At Virtualitics, we believe that the Explore step is critical to the success of any AI and advanced analytics project. We’re helping you explore without limits.
Download our e-book Building a Sustainable AI Strategy from the Ground Up advanced to learn more about how you can use Virtualitics to power your AI and Data strategies.