
Written by Aakash Indurkhya
Jun 25, 2022 9:52:32 PM
One of the biggest frustrations in business today is that companies are not getting enough value from all the data they’ve been collecting and storing. Leaders know the answers they want are splashing around in that big lake of data: the right pricing structure, a smoother-running supply chain, service experiences that make people lifelong customers.
But the struggles are real. Businesses don’t know where to begin looking for insight. They fear they might perpetuate bias within their AI models. Jargon and visualizations are so complex it’s hard to see what’s really going on.
Enter a new integration that solves these problems: The Virtualitics AI Platform helps teams make better use of what’s in a data lake. You can explore your data using AI to do the legwork, drop yourself into a visual story in a matter of seconds, get AI-generated recommendations in simple terms, and take action, in one platform. Here’s a rundown.
How the Virtualitics and Databricks integration works
The thousands of companies that rely on Databricks’ Lakehouse Platform to unify their data and produce usable analytics and AI can:
- Easily and securely connect to data in Databricks Delta directly from the Virtualitics AI Platform. Data stays securely where it resides.
- Accelerate discovery using AI. Our 3D, multivariable, AI-guided visualizations find and illuminate data relationships in complex relationships–up to two 12 dimensions!--in ways that 2D visualizations can’t.
- Transform tabular data into network graphs. In just a few clicks you can transform tabular data into intuitive, meaningful, and interactive 3D network graphs, without having to do a lot of formatting.
And you can facilitate all of this while keeping access to your data secure and without having to manage a bunch of credentials. After your administrator sets up a Databricks cluster for use in Virtualitics, your team of data scientists, analysts, and business users can access the configured data cluster from Virtualitics. Data remains secure without slowing anyone down.
Bring the power of advanced analytics within reach of more people
Databricks users can benefit from Virtualitics’ multi-user interface because it can enable hundreds more people across the business to get value from complex datasets, instead of a small team of expert data scientists. Analysts and citizen data scientists can do self-serve data exploration by querying large datasets with the ease of typing in question and AI-guided exploration instead of writing lines of code. Business decision makers get their hands on AI-generated insights that can help them take smart, predictive actions.
And your scarce data science resources can stay focused on complex data analysis and building the right machine learning models, (informed by insights and direction from the data).
Take the example of a financial services company that wants to comply with international sanctions against Russian companies and individuals. There are over 10,000 sanctions in place with more being added. Uncovering hidden financial relationships is a perfect job for AI-generated visualization.
A company could start with a database of taxpayer ID numbers, then layer on tabulated lists of registered limited liability corporations (LLCs), a common structure for shell companies in the US. The user could then look for transactions between sanctioned taxpayer entities and other entities that share common information, like email addresses, addresses, and more. Connections that were hidden become visible, automatically surfaced by our network extractor or smart mapping technology (and the best thing is, Virtualitics is smart enough to know which technique to use for the data provided and the query made).
Insights and accurate predictions, faster
Another benefit of using Virtualitics through Databricks Connect is that our platform tells you where to focus, where the gaps in your data are, and what’s important. It does this in seconds and follows-through with plain English explanations.
Less technical users and new users can perform sophisticated analyses without having to know data science terminology. Virtualitics’ Natural Language Query Assistant lets you use simple commands like “What relationships exist between my products?” If you’re not sure what to ask, the system provides Suggested Queries. In our Russian sanctions example, for instance, anyone could type in a query like “Find anomalous transactions” and see which factors are most likely to drive questionable transactions and specifically which records were anomalous.
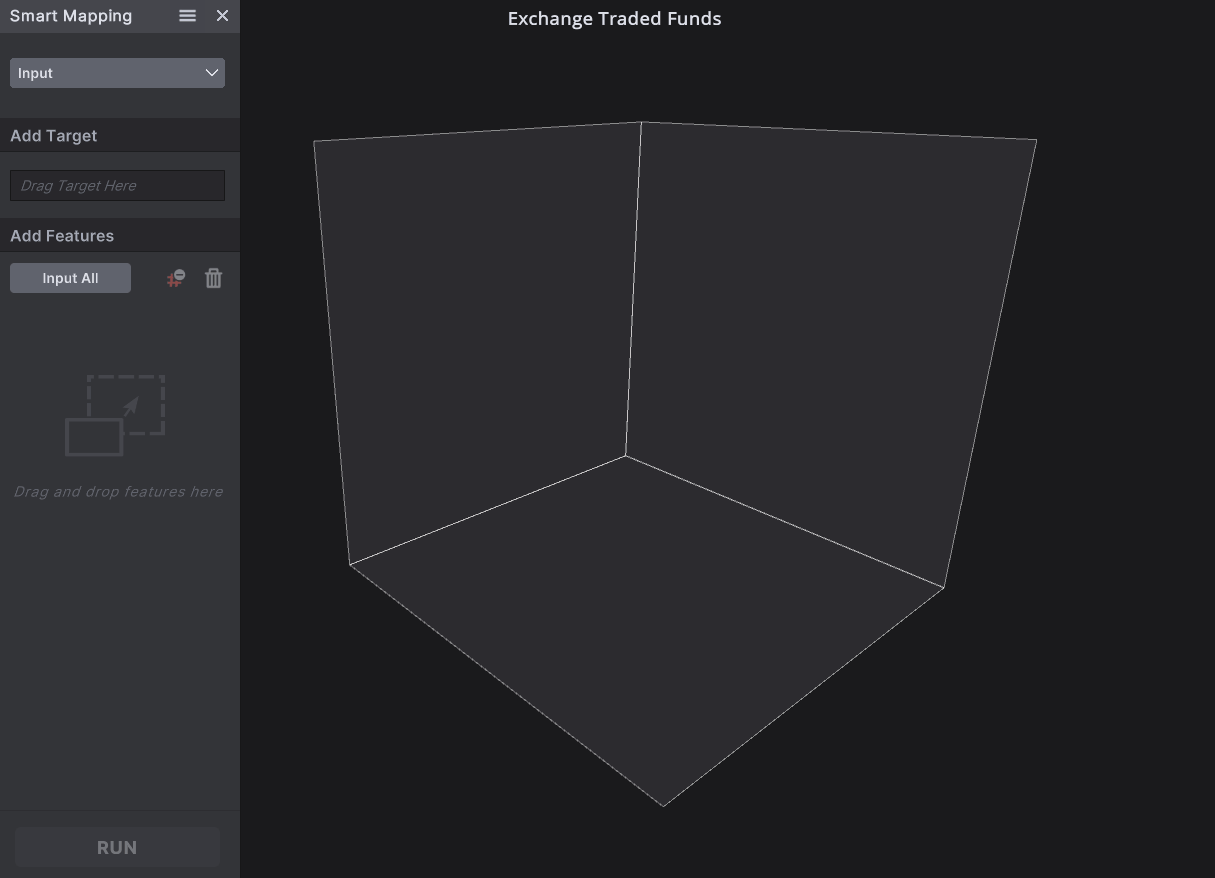
As the number of variables you need to consider increases, the number of 2D plots you need to consider becomes overwhelming and tedious. This is where our AI can help to find the right combination of variables to use and just show one rich and meaningful data visualization. Smart mapping, another powerful AI-driven visualization routine in our platform, helps you instantly understand the key driving features in data. It’s especially handy at uncovering hidden relationships within your data when you’re working with a large number of features, by automatically generating several AI-suggested visualizations for you to interpret the results.
For example, you can discover that Variance and Region are the largest driving factors for returns over a three-year period in an Exchange Traded Fund (ETF) dataset.
When it comes time for recommendations, explainability is baked in, with users seeing the context for the prescriptions generated. Virtualitics provides both direction and the “why” behind recommendations. Then we go to the next step, closing the gap between prescription and decision, by embedding the point of action right in the dashboard.
.gif?width=3297&name=Pilot%20Dashboard%20Animated%20Network%20(1).gif)
Turn complex data sets into 3D visualizations—without coding
There’s a network of relationships hidden in your spreadsheets or tabulated data that you may not have the right tool to see. Virtualitics’ patented technology can extract hidden networks (network graphs) and show them as 3D data visualizations, whether your data is numerical, categorical, or unstructured. This process is automated, without requiring lots of math, specially coded files, or additional visualization apps.
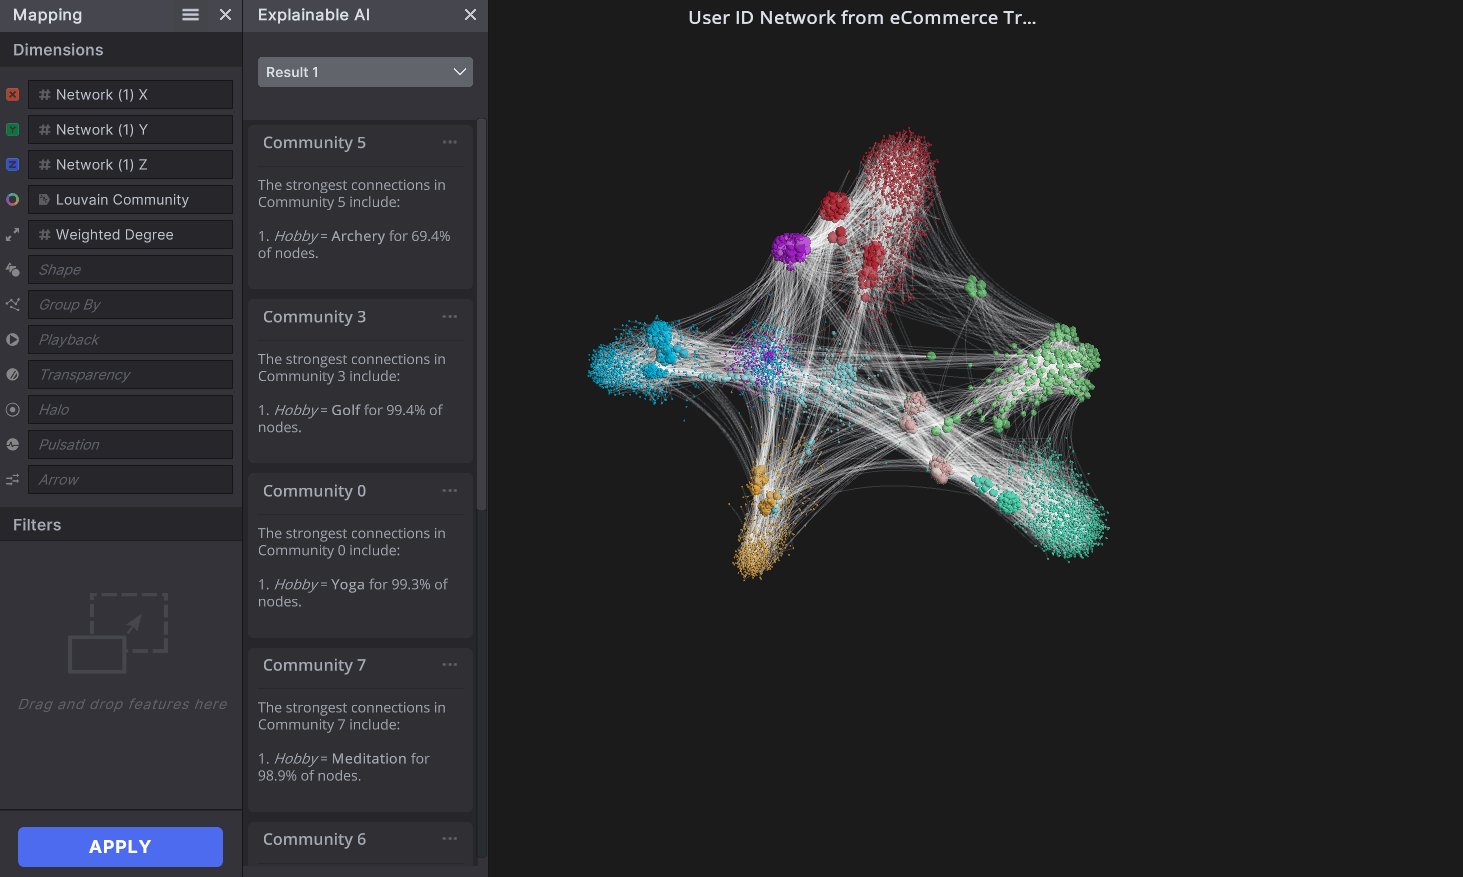
Virtualitics network graph with explainable AI.
Here’s how this works without our technology: Traditional data visualization tools require a properly formatted file. Meaning that you have to carefully analyze your data before it’s turned into a visual product. In fact, in many cases you would need to be an expert at creating knowledge graphs, graph theory, and writing code to be able to create that file. Plus, the visual that is typically produced from the formatted file is a 2D plot, with data points trampling over each other with no obvious means to segment it out.
Specifically, our network visualizations show communities of interconnected points extracted from your tabular dataset by our AI. The relationships are automatically extracted and rendered in interactive 3D visual while providing clear explanations for how the communities of points were formed. For example, you can explore commonalities among pre-approved credit card prospects, you can discover the attributes that define an optimized customer segmentation, determine common behaviors in troll factories distorting the narratives on social media, and so on. Virtualitics’ network visualizations can help you boil down millions of records into a handful of easy to grasp relationships, processes, and insights that you will miss with traditional BI tools. These AI-guided explorations help surface biases or unintentional artifacts in your data that become apparent when viewing data the way a predictive model does.
Another benefit of Virtualitics is the ability to render such graphs 100X faster than other graphing tools. Other software solutions’ capabilities end with the visualization: they don’t offer other tools or AI routines, explanations, or story-telling capabilities that you need to get your data to work for you.
Businesses get more value from data with Virtualitics and Databricks
For companies using Databricks, Virtualitics helps deliver more value from data by bridging the gap between data science and business action. For citizen data scientists and data analysts, Virtualitics makes it easy to explore complex data and generate the insights that matter to a business. For data scientists, Virtualitics can revolutionize the critical story-telling and model delivery segments of the AI lifecycle and get more value from their Databricks clusters. Look for a more technical how-to on this integration in a coming post.
To get started and see a demo, contact us.