.png)
Written by Virtualitics
Sep 6, 2023 8:46:08 AM
Organizations today recognize the potential of their data to drive business-changing insight. However, as data sets become more complex and robust, analyzing comprehensively using traditional methods has become difficult.
Multidimensional data is one such data set, capable of helping analysts uncover critical information that leads to better strategic decision-making. But this complex data requires looking beyond two-dimensional structures, so not every company is able to take full advantage of it.
Let's talk about why multidimensional data is so important to businesses and how your analysts can leverage it more regularly.
What is Multidimensional Data?
Multidimensional data is a data set with many different columns, which are also called features or attributes. The more columns in the data set, the more potential there is to discover hidden insights. A two-dimensional analysis falls flat in this regard because it only lets you look at the data through two attributes.
You could organize these multiple attributes on a chart or other 2D rendering, but the human brain wasn’t built to make sense of this much information in this way. It’s impossible to truly see all the connections and relationships happening between attributes. But when multidimensional data is viewed as a cube on multiple planes, for example, it’s possible to look at far more factors in one image.

Multidimensional data models organize the many attributes in a clearer way, enabling users to dig deeper into probable trends or patterns. You can interrogate queries rather than just submit them, as practiced in relational databases. It’s also a comparatively fast exercise, manipulating the different dimensions and perspectives by attribute.
When a noteworthy insight rises to the surface true 3D illustrates the connections concisely. An enormous quantity of relevant data is arranged and depicted in ways that humans can better grasp.
What Are the Advantages of Multidimensional Data?
In simple terms, lots of dimensions deliver lots of information. As a result, the potential for insight increases. Analyzing multidimensional data is most impactful when it’s examined in the way that our brains process best—in 3D.
“Multidimensional visualizations can show more complex analyses and enable the user to look at them from different angles, facilitating discovery,” Virtualitics co-founder and CTO, Ciro Donalek, said in this article. “This visual approach also adds ‘explainability’ to complex concepts that non-data-scientists, such as product owners and management, need to drive decision-making and meet business objectives.”
An AI-driven analysis platform like Virtualitics, which also models data using 3D visualizations, increases the benefits of working with multidimensional data by allowing users to:
- Group similar information. All like information combines into a single dimension. This process keeps things organized and makes it easy to view and compare.
- Visualize the output of complex data. When working with this model in a platform, you can visually recognize the outcomes of data analysis.
- Identify patterns, trends, outliers, and anomalies. There are no hidden data points in this “cubed” data visualization. You have everything grouped and organized so you can more easily recognize the insights. You can also build interactive reports for these elements.
- Examine relationships among data from multiple sources. You can add many layers of source data to build your cube and discover patterns.
- Improve collaboration and analysis across geographic locations. By using this model, you can more easily work with users with tools in a shared virtual office. It's secure and allows people from different locations to work on the data at the same time.
- Extract valuable information from unstructured data. Unstructured data can be a pain point in analysis, but it’s no longer an issue with multidimensional data tools.
- Add “explainability” for non-data scientist stakeholders. Explaining data in an approachable manner is critical to driving better decision-making across the enterprise. Multidimensional data makes this possible.
- Compare the impact of changes to variables on the target data easily. If you want to understand the effect of change on specific data, you can with little strain.
- Process data quickly. You’ll gain speed with multidimensional data versus a relational database. The setup may be longer, but in the end, your processing will be faster.
- Maintain data efficiently. Because you’re storing data in the same way it’s viewed, maintenance is simple.
- Save money. Multidimensional data models perform better and are more cost-effective than relational ones.
Want to fully realize the advantages of multidimensional data at your organization? Then it’s crucial to spread its use beyond the data science team and give every business analyst the power to intelligently explore this type of data set.
How Intelligent Exploration Democratizes Multidimensional Data
As organizations continue to create more data and advanced data science skills become harder to find, companies are investing in tools that will enable analysts to go beyond surface-level analysis of limited attributes.
According to Gartner’s Hype Cycle for Analytics and Business Intelligence 2023 report: “Organizations must be able to deliver the most relevant, contextualized and consumable analytics outputs possible. This requires tapping into the unique intersection of various devices, interaction modalities and analytics capabilities that can augment users’ ability to consume insights.”
Intelligent Exploration through the Virtualitics platform empowers analysts to explore complex data with confidence and deliver actionable insight to stakeholders. When powered by AI, visualizations of multidimensional data explain the output of machine learning models and main drivers in a more intuitive way. They also reveal complex relationships that live at the intersection of many dimensions, showing logical connections and communities within the datasets.
With this ability to see—and visually render—complex relationships in data, analysts can more easily perceive what’s really going on and explain their findings to stakeholders.
What Are Multidimensional Data Uses Cases?
Within a business, there are many reasons to leverage multidimensional data and visualizations to investigate the past, present, and possible futures. Here are four use cases:
Improve Target Marketing
Every marketer wants to personalize communication and offerings to specific customers based on a host of data sets. Those may include demographics, consumer behavior trends, and detailed information about a customer’s past interactions with your brand.
With all these attributes, it can be challenging to see correlations in a static, 2D analysis. With multidimensional data models, you see the complete picture, which can lead you to clearer conclusions about how to better reach your target customers. For example, you may find that the time of day influences how big an order is and therefore, schedule email offers to go out just before that hour.
Increase Uptime Beyond Predictive Maintenance
Predicting when equipment needs maintenance before it breaks or fails is key to minimizing downtime. Maintenance indicators vary widely depending on the complexity of the machinery. A great example of this is predictive maintenance for airplanes. These sophisticated machines require multiple technologies to facilitate their operation and maintenance—and all the data these systems produce can be built into a multidimensional data model for proactive maintenance analysis. We call this method Integrated Resource Optimization.
“The connections between key drivers like failure data and your maintenance and logistics activities like time to repair and inventory optimization are the places where you’re able to implement strategic practices that will positively impact your readiness rate,” wrote Jerami Reyna, a former lead maintenance manager in the United States Air Force and now Solutions Lead at Virtualitics.
Prioritize the Right Risks and Outliers
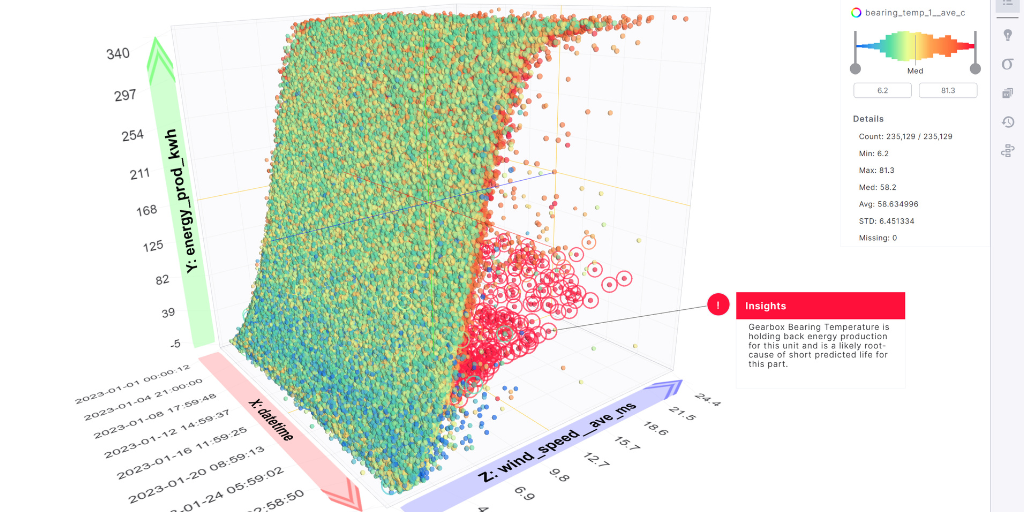
Predictive maintenance is part of a larger practice called Integrated Resource Optimization, which provides a big-picture view of maintenance operations. Let’s say you operate a wind turbine farm spread across multiple locations. Knowing where to prioritize resources can be incredibly difficult, especially when maintenance operations produce and collect a lot of information: parts inventory lists, staffing plans, procedures, repair times, repair logs, shift planning, and so much more.
But when all that information can be centralized and AI helps to analyze the relationships between all the dimensions, you’re able to surface key insights about where maintenance will be most effective. In the case of the wind farm, the system identified that a wind turbine has an average failure risk of only 38%, but the risk of gearbox failure is 95% and will break in about 10 days. It might seem counterintuitive to focus on a wind turbine with low average risk, but by fixing this one component, we can take proactive measures to ensure the overall production of this wind turbine remains high over the course of its lifespan.
Analyzing Complex Biological Data
Multiomics is another use case for multidimensional data. The data sets are all “omes”—genome, proteome, microbiome, and so on—related to health and disease analysis. As you can see, there are many features of the data, and it’s very complex. In traditional databases, there are limitations for researchers because they can only isolate single data points.
The key is the integration of data, but this is difficult to do—unless you’re doing a multidimensional analysis. Such a configuration allows researchers to understand public health better and discern correlations that fill current gaps in knowledge.
Experience the Power of Multidimensional Data
Leveraging multidimensional data lets you see your business opportunities and weaknesses like never before. When analysts are able to explore this data themselves, using the right tools, they become the frontline in discovering, validating, and socializing the projects that add the most competitive advantage to the business.
Ready to learn more?